Unit 11 - Processing survey data
Survey answers are typically of the style below, with a very specific question and a Likert scale that forces the answers into clearly defined categories.
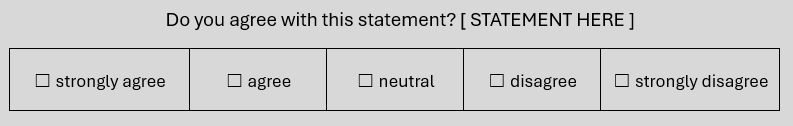
This is easy to process, as the answers can be tabulated. Some surveys, however, allow free-text answers. This is the case in the type of question you get at the end of a survey, something like “Anything else you’d like to tell us?”. It’s also common in focus groups and submissions in public consultation processes. These can go from one-word answers and short sentences to long paragraphs. That’s the type of unstructured data that you need text analysis for!
There are many ways we can analyze and summarize the information. we’ll focus on:
Visualization with word clouds
NER recognition
Redaction
Data
There are many public surveys and sources of data (see at the end for more links). Here, we will work with the Democracy Checkup distributed by Odesi, a Canadian consortium that holds social science data. This is a survey of Canadian attitudes about democratic values, public policies, and current issues:
Harell, Allison; Stephenson, B. Laura; Rubenson, Daniel; Loewen, Peter John, 2023, “Democracy Checkup, 2022. Canada”, Harell et al. (2023), Borealis, V1, UNF:6:ufqbMikbXcaHqVhbaEXR3w== (fileUNF)
The data contains many different variables, most of them numeric or on a scale with fixed values to choose from. But some of the values are free-form text answers; we’ll study those.
Import statements
# run this only once, to install wordcloud

!pip install wordcloud
import os
import numpy as np
import pandas as pd
import matplotlib.pyplot as plt
from wordcloud import WordCloud
import nltk
from nltk import word_tokenize
from nltk import FreqDist
from nltk.corpus import stopwords
stop_words = stopwords.words('english')
import spacy
nlp = spacy.load("en_core_web_sm")
from spacy import displacyImport and examine the data
The data is huge: 9,829 rows (answers) and 501 questions (columns). As you can see from the output of df.head(), most of the data is numerical, so we’ll work only with text columns. Luckily, those columns always end with the string “TEXT”, so we can use pandas to extract them. For instance:
dc22_vote_choice_6_TEXT -- what party the person intends to vote for (in Dec 2022)
dc22_soc_media_use_9_TEXT -- what social media the person uses
dc22_language_3_TEXT -- what language the person speaks
etc.
You can use the Data explorer for this dataset to check the actual questions for each of these columns.
df = pd.read_csv('./data/cora-cdem-2022_F1.csv', encoding = 'utf-8')df.info()df.head()# check which columns contain the word "TEXT" using a regular expression
print(df.filter(regex='TEXT').columns)# create a new dataframe, 'df_text' that contains only those columns
df_text = df.filter(regex='TEXT')df_text.head()Working with one column
We will work with one of the columns, ‘dc22_vote_choice_6_TEXT’, where the question was: “If a federal election were held today, which party would you be most likely to vote for?”
We will first extract data from that column to a pandas series. When extracting, we will drop any empty values (NaN) with dropna() and the columns that contain ‘-99’, which means the person did not answer this question.
Then, we put that into a string variable and lowercase it (so that “People’s Party” and “People’s party” are considered the same). But then we realize actually that the word “party” occurs here a lot, so we’ll simply remove it with the stopwords.
Finally, we have a somewhat clean string of words that we can send to WordCloud to visualize.
# most of the values are '-99' (unanswered)
# but you can sort other values to find the most frequent in a column

df_text['dc22_vote_choice_6_TEXT'].value_counts()[:20].sort_values(ascending=False)
vote_choice = df_text['dc22_vote_choice_6_TEXT'].dropna().loc[df_text['dc22_vote_choice_6_TEXT'].str.contains('99') == False]vote_choice# this is a pandas series, so we'll convert it to a string
type(vote_choice)vote_choice_str = ', '.join(vote_choice.astype(str))vote_choice_str# check the contents of stop_words
stop_words# append the word "party"
stop_words.append('party')
stop_words.append('Canada')
stop_words.append('canada')
# define a function that: 1. tokenizes, 2. lowercases and
# 3. removes stopwords

def clean_text(text):
    words = word_tokenize(text.lower())
    cleaned_words = [word for word in words if word.isalpha() and word not in stop_words]
    return ' '.join(cleaned_words)
vote_choice_clean = clean_text(vote_choice_str)vote_choice_cleanGet frequencies
You’ll see below that WordCloud randomizes the font size of the output. But sometimes we want that to be meaningful, reflecting how frequent the word is. To get that information, we will use NLTK’s FreqDist and generate a dictionary when we clean the text.
# define a function that: 1. tokenizes, 2. lowercases,
# 3. removes stopwords and 4. counts the words

def clean_text_freq(text):
    words = word_tokenize(text.lower())
    cleaned_words = [word for word in words if word.isalpha() and word not in stop_words]
    freq_dist = FreqDist(cleaned_words)
    return freq_dist
vote_choice_dict = clean_text_freq(vote_choice_str)vote_choice_dictWord clouds
Word clouds are popular and can look very cool in a report. They can also be misleading if the size of the font does not correspond to the frequency of the word in the data, so you should use them with caution.
We’ll use the Wordcloud library, which we imported above. There are many options for how to do this. Here are two possibilities, changing the shape and the background colour. Check out the example gallery for more.
# options
x, y = np.ogrid[:300, :300]

mask = (x - 150) ** 2 + (y - 150) ** 2 > 130 ** 2
mask = 255 * mask.astype(int)

# this actually generates the word cloud
wc = WordCloud(background_color="white", repeat=True, mask=mask)
wc.generate(vote_choice_clean)

# and this displays it
plt.axis("off")
plt.imshow(wc, interpolation="bilinear")
plt.show()
wordcloud = WordCloud().generate(vote_choice_clean)
plt.imshow(wordcloud, interpolation='bilinear')
plt.axis("off")
plt.show()##bigger
wordcloud = WordCloud().generate(vote_choice_clean)
plt.figure(figsize=(10, 5))
plt.imshow(wordcloud, interpolation='bilinear')
plt.axis('off')
plt.show()With the frequency dictionary
Recall that above we created a dictionary of the frequency of each word. We can use it to display relative to frequency.
wordcloud = WordCloud().generate_from_frequencies(vote_choice_dict)

plt.figure(figsize=(10, 5))
plt.imshow(wordcloud, interpolation='bilinear')
plt.axis('off')
plt.show()
Named entities
Another thing you may want to do with survey results is extract the named entities mentioned in the text. Remember that we can do this with spaCy (see Unit 6).
We will use the variable vote_choice_str from earlier, which is simply the running text of the column about vote choice. We process it with spaCy (which was imported at the top) and we can print the entities that are of type ‘ORG’, which should correspond to a political party.
vote_choice_doc = nlp(vote_choice_str)vote_choice_str# print all entities and their label
# note that there are errors here
for ent in vote_choice_doc.ents:
print(ent.text, ent.label_)# print the ORG entities
for ent in vote_choice_doc.ents:
if ent.label_ == "ORG":
print(ent.text)Redacting documents
This idea comes from an NLP notebook on redacting names. Once you have named entities identified (hopefully accurately), you can also use the NER output to redact any personal information. For instance, you can identify all the person’s names and remove them or replace them with something like ‘REDACTED’.
def sanitize_names(text):
    doc = nlp(text)
    redacted_sentences = []

    for token in doc:
        if token.ent_type_ == 'PERSON':
            redacted_sentences.append("[REDACTED]")
        else:
            redacted_sentences.append(token.text)

    return ' '.join(redacted_sentences)
vote_choice_redacted = sanitize_names(vote_choice_str)vote_choice_redactedSummary
We have learned about processing and aggregating survey data. This notebook has used some concepts we have learned previously:
Tokenization
Lowercasing
Removing stopwords
Creating a function to clean text
Reading in and manipulating data in pandas
New information:
Creating word clouds
Using NER (named entity recognition) to redact documents
- Harell, A., Stephenson, B. L., Rubenson, D., & Loewen, P. J. (2023). Democracy Checkup, 2022 [Canada]. In Democracy Checkup. Borealis. 10.5683/SP3/TEKM3T